NS3 GUI
NetAnim:
- NetAnim is a stand-alone program which uses the custom trace files generated by the animation interface to graphically display the simulation. NetAnim is based on the multi-platformQt4 GUI toolkit
- The NetAnim GUI provides play, pause, and record buttons. Play and pause start and stop the simulation.
- The record button starts a series of screenshots of the animator, which are written to the directory in which the trace file was run.
- Two slider bars also exist.
- The top slider provides a “seek” functionality, which allows a user to skip to any moment in the simulation.
- The bottom slider changes the granularity of the time step for the animation. Finally, there is a quit button to stop the simulation and quit the animator.
PyViz method
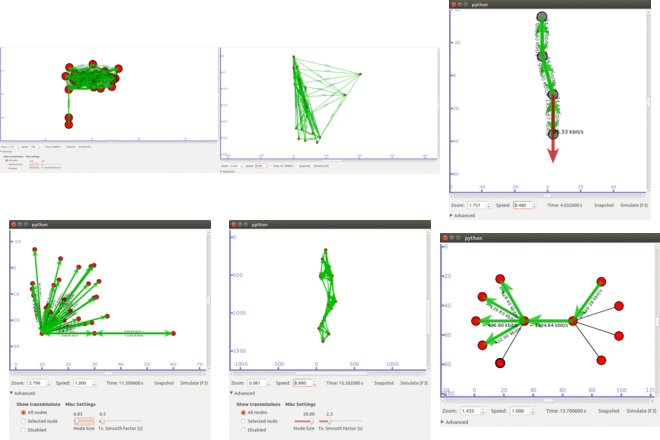
- PyViz uses Gtk+ and GooCanvas for the GUI part, and also accesses the ns-3 API directly, all via respective Python bindings.
- LTE devices do not support visualizer yet.
- The Visualizer class is a singleton that controls the whole visualizer GUI.
- It contains a list of nodes and channels, the canvas (goocanvas.Canvas), a list of arrows used to represent the packet transmissions, and assorted GUI elements, like the play/pause button

 Click Here to watch our latest output video using NS3 simulator
  Click Here to watch our latest projects screenshots using NS3 simulator