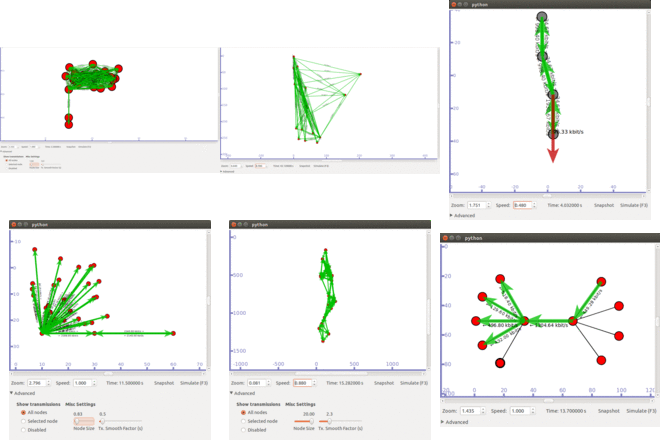
How to Begin Implement Network Congestion in NS3
To implement and analyze Network Congestion in ns-3, follow these steps. Network congestion occurs after the request for network resources exceeds their availability, resulting in increased delays, packet losses, and decreased throughput.
Steps to Begin Implement Network Congestion in NS3
- Understand Network Congestion
Traffic is typically caused through:
- High traffic volume: Too many packets forwarding continuously.
- Limited bandwidth: Not enough for the channel capacity.
- Queue overflows: Buffers at intermediate nodes or endpoints cannot provide somewhere to stay the received packets.
Key metrics to analyze congestion:
- Throughput
- Packet loss rate
- Queue occupancy
- End-to-end delay
- Set up Your Environment
Assure the tool ns-3 is installed. Use suitable components such as Point-to-Point, Wi-Fi, or LTE for generate the network that can replicate the traffic environment.
- Create the Network Topology
Example: Star Topology with Bottleneck Link
NodeContainer nodes;
nodes.Create(5); // One center node and four peripheral nodes
PointToPointHelper pointToPoint;
pointToPoint.SetDeviceAttribute(“DataRate”, StringValue(“10Mbps”));
pointToPoint.SetChannelAttribute(“Delay”, StringValue(“2ms”));
// Connect each peripheral node to the center node
NetDeviceContainer devices;
for (uint32_t i = 1; i < nodes.GetN(); ++i) {
devices.Add(pointToPoint.Install(nodes.Get(0), nodes.Get(i)));
}
- Install the Internet Stack
Install the Internet stack for ensure the routing:
InternetStackHelper stack;
stack.Install(nodes);
Ipv4AddressHelper address;
address.SetBase(“10.1.1.0”, “255.255.255.0”);
Ipv4InterfaceContainer interfaces = address.Assign(devices);
- Simulate Traffic
Make a several sources are forwarding the congestion for equal destination has involves the congestion.
Example: UDP Traffic
UdpEchoServerHelper echoServer(9);
ApplicationContainer serverApps = echoServer.Install(nodes.Get(0)); // Center node as the server
serverApps.Start(Seconds(1.0));
serverApps.Stop(Seconds(10.0));
for (uint32_t i = 1; i < nodes.GetN(); ++i) {
UdpEchoClientHelper echoClient(interfaces.GetAddress(0), 9);
echoClient.SetAttribute(“MaxPackets”, UintegerValue(1000));
echoClient.SetAttribute(“Interval”, TimeValue(Seconds(0.01))); // High traffic rate (10ms interval)
echoClient.SetAttribute(“PacketSize”, UintegerValue(1024)); // 1KB packets
ApplicationContainer clientApps = echoClient.Install(nodes.Get(i)); // Peripheral nodes as clients
clientApps.Start(Seconds(2.0));
clientApps.Stop(Seconds(10.0));
}
- Introduce Congestion
To replicate the traffic:
- Reduce Bottleneck Bandwidth:
pointToPoint.SetDeviceAttribute(“DataRate”, StringValue(“1Mbps”)); // Reduce bandwidth to create congestion
- Increase Traffic Load:
- It reduced the packet interval for create further congestion.
- Improve the further client nodes are forwarding a congestion to the similar server.
- Limit Queue Size:
pointToPoint.SetQueue(“ns3::DropTailQueue”,
“MaxSize”, StringValue(“10p”)); // Small queue size (10 packets)
- Monitor Congestion Metrics
Throughput
Used to calculate the throughput FlowMonitor:
FlowMonitorHelper flowmon;
Ptr<FlowMonitor> monitor = flowmon.InstallAll();
Simulator::Stop(Seconds(10.0));
Simulator::Run();
monitor->CheckForLostPackets();
Ptr<Ipv4FlowClassifier> classifier = DynamicCast<Ipv4FlowClassifier>(flowmon.GetClassifier());
std::map<FlowId, FlowMonitor::FlowStats> stats = monitor->GetFlowStats();
for (auto& flow : stats) {
double throughput = flow.second.rxBytes * 8.0 / (flow.second.timeLastRxPacket.GetSeconds() – flow.second.timeFirstTxPacket.GetSeconds());
std::cout << “Flow ” << flow.first << ” Throughput: ” << throughput / 1e6 << ” Mbps\n”;
}
Packet Loss
Log stopped the packets are used to queue trace callbacks:
Ptr<Queue<Packet>> queue = StaticCast<PointToPointNetDevice>(devices.Get(0))->GetQueue();
queue->TraceConnectWithoutContext(“Drop”, MakeCallback([](Ptr<const Packet> packet) {
std::cout << “Packet dropped at time ” << Simulator::Now().GetSeconds() << “s\n”;
}));
Queue Occupancy
Track the queue size over time:
queue->TraceConnectWithoutContext(“PacketsInQueue”, MakeCallback([](uint32_t qSize) {
std::cout << “Queue size: ” << qSize << ” packets at time ” << Simulator::Now().GetSeconds() << “s\n”;
}));
End-to-End Delay
Estimate the average delay for using a FlowMonitor:
for (auto& flow : stats) {
double avgDelay = flow.second.delaySum.GetSeconds() / flow.second.rxPackets;
std::cout << “Flow ” << flow.first << ” Average Delay: ” << avgDelay << ” seconds\n”;
}
- Enable Tracing
ASCII and PCAP Tracing
Log complete actions for analysis:
AsciiTraceHelper ascii;
pointToPoint.EnableAsciiAll(ascii.CreateFileStream(“network_congestion.tr”));
pointToPoint.EnablePcapAll(“network_congestion”);
XML Animation
Used for envision the packet flows and congestion impact such as NetAnim:
AnimationInterface anim(“network_congestion.xml”);
- Experiment with Parameters
- Queue Type: Validate by changed queue components for example DropTailQueue, RedQueue.
- Traffic Patterns: It replicate the changed congestion loads for kinds of application.
- Topology: Improve the number of nodes for build further congested environments.
- Run the Simulation
It process for the replication and analyze the outcomes:
Simulator::Run();
Simulator::Destroy();
In the end of the manual, we had extremely deliver the comprehensive details about how to setup and how to execute the network congestion in ns3 simulator. More information will be shared about how the network congestion will perform in other simulation tool.

 Click Here to watch our latest output video using NS3 simulator
  Click Here to watch our latest projects screenshots using NS3 simulator